BGL Technical Notes
BGL Technical Notes
Analysing Fault Seal Capacities in Field Appraisal: A Case Study from Oseberg Syd
Abstract
A fault seal study has been performed on faults in the Oseberg Syd area, located within Block 30/9
of the Norwegian sector of the North Sea. The area is structurally complex and heavily
compartmentalised. Despite this, almost all of the individual fault blocks that have been drilled
have been found to contain oil and gas. This study attempts to achieve a better understanding of
reservoir separation, fault linkage and the likelihood for seal along individual faults via detailed
3D structural modelling and fault seal analysis on 16 block-bounding faults using a commercial G&G
software package (T7). The results (most strikingly illustrated by two end members: a sealing fault
and a non-sealing fault) suggest that SGR values below or close to 15% correspond to no seal; SGR
values between ca. 15-18% are consistent with adjacent fault blocks having small pressure
differentials (
< 1 bar or 30 m difference in OWC) and SGR values of>18% correspond to significant seal (8 bar
pressure difference or up to 240 m difference in OWC). This SGR calibration was found to be
consistent with observed fluid contacts and pressure data in all the Oseberg Syd wells. Finally,
the SGR distributions for faults lacking sufficient well control points, were used to predict
likely seal capacities and therefore constrain the occurrence of hydrocarbons in undrilled
compartments.
Click here to download PDF
|
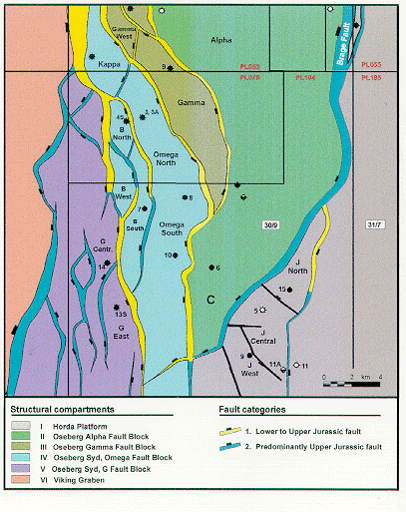
Figure 1. Location map of the Oseberg South Area, Norway, showing geological structure and well locations. |
|
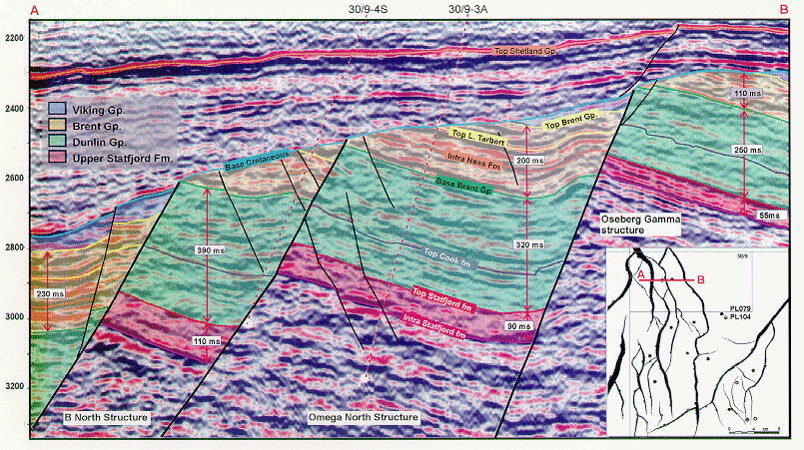
Figure 2. E-W oriented seismic section through the north-western part of the area of study showing typical faulting and stratigraphy. |
|
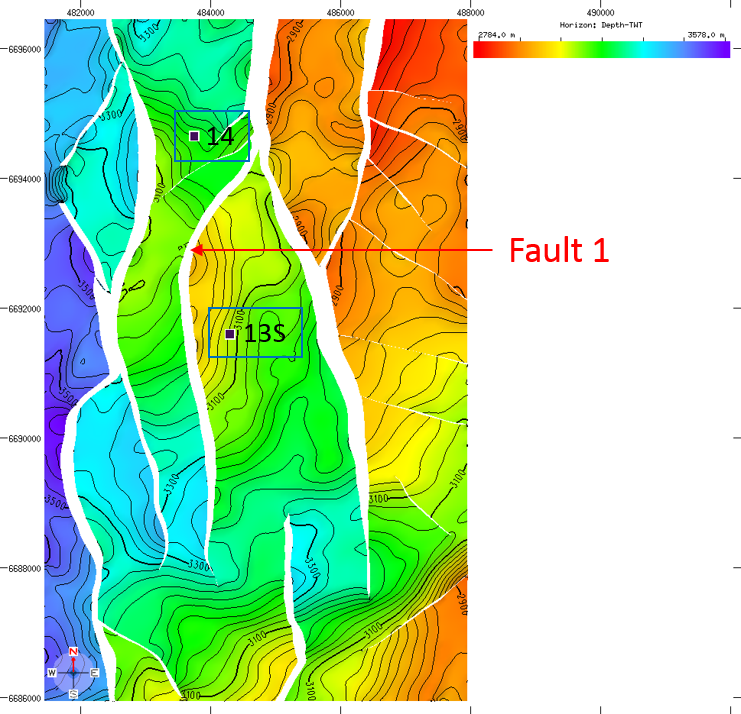
Figure 3. Fault map of the Oseberg Syd area, on the Lower Tarbert horizon, showing the location of Fault 1 (indicated by the red arrow). |
|
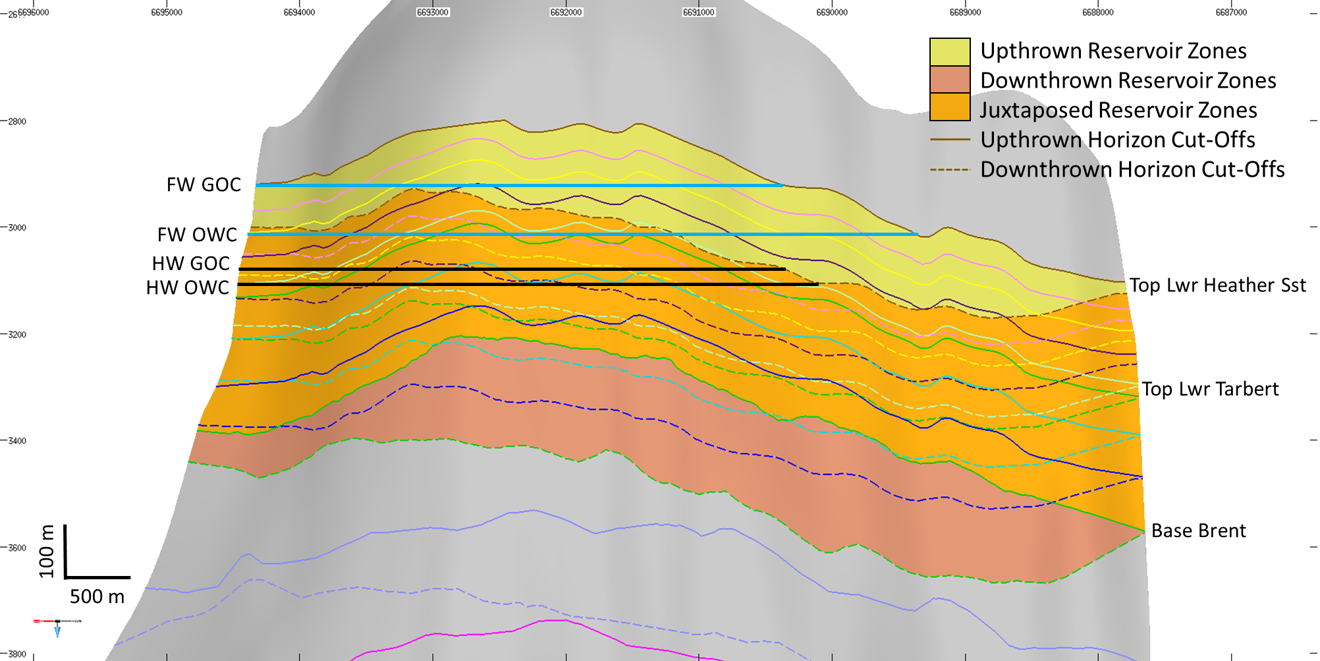
Figure 4. Allan diagram (strike projection looking east) showing footwall intervals (solid colour) and hanging wall intervals (dashed). Yellow: footwall sands. Dark orange: hanging wall sands. Light orange: overlapping (juxtaposed) sands. |
|
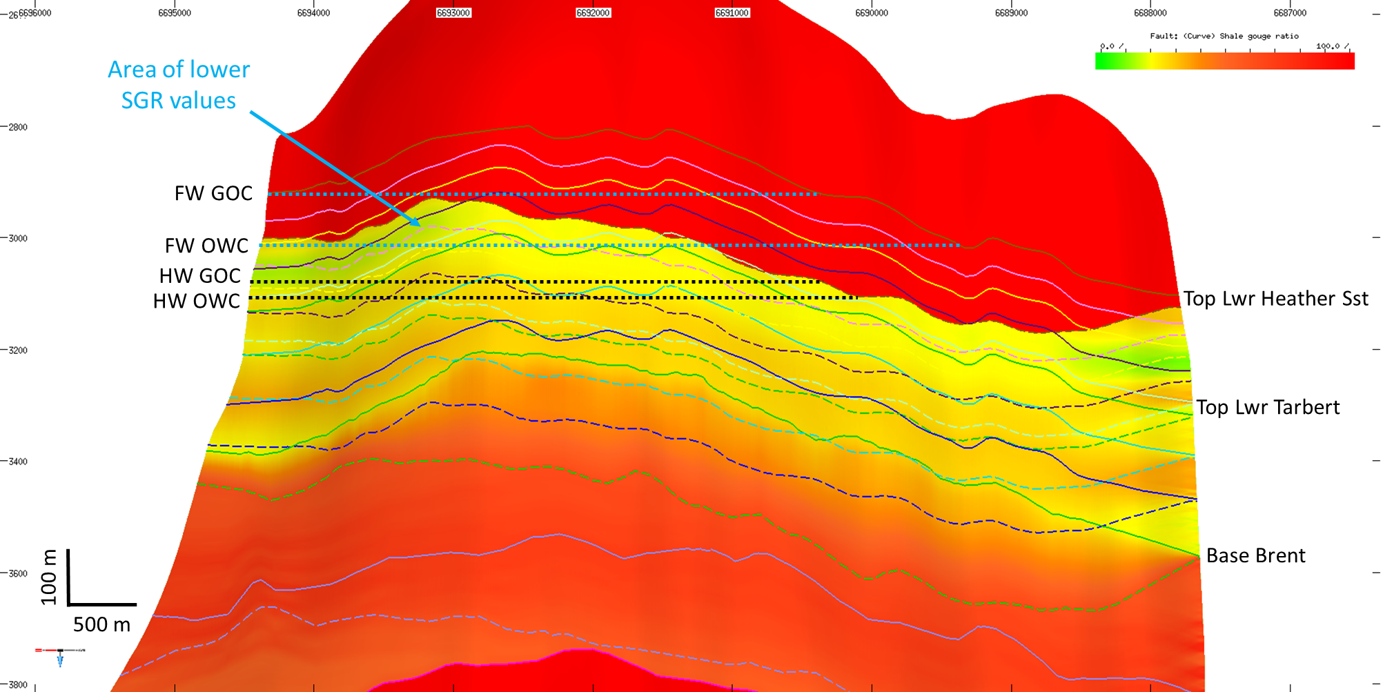
Figure 5. Reservoir juxtaposition plot showing area of reservoir overlap colour filled with Shale Gouge Ratio. Low SGR values in pale yellow; high SGR values in red. Area of lower SGR values indicated by the blue arrow. |
|
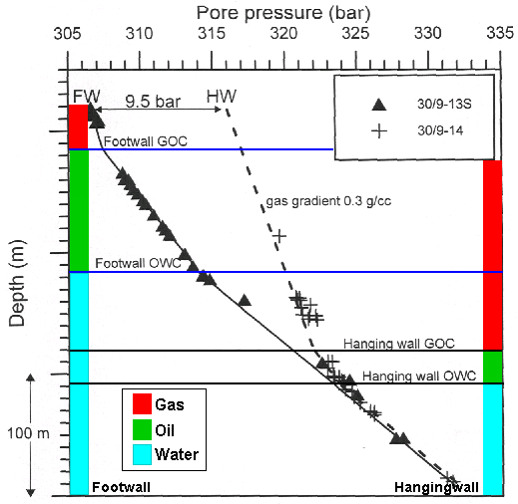
Figure 6. Pressure profiles for Wells 13S (footwall) and 14 (hanging wall). |
|
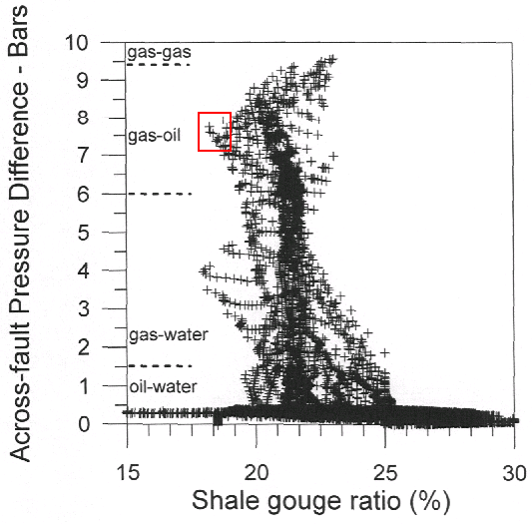
Figure 7. Cross-plot of SGR versus across-fault pressure difference. |

|
Figure 8. Across-fault pressure difference in sand-sand juxtaposed regions along the fault surface. Note that the footwall gas column continues above the FW GOC, however, the footwall reservoir is juxtaposed against shale here. Across fault pressure increases from 0 bars below the HW GOC (where FW and HW aquifers are juxtaposed) to about 9.5 bars. The section of the fault with the highest across fault pressure difference relies upon the fault rock to provide a seal. The arrowed zone (from Figure 5) it can be seen this zone has the lowest predicted SGR values associated, therefore is a critical region on the fault surface. |
|
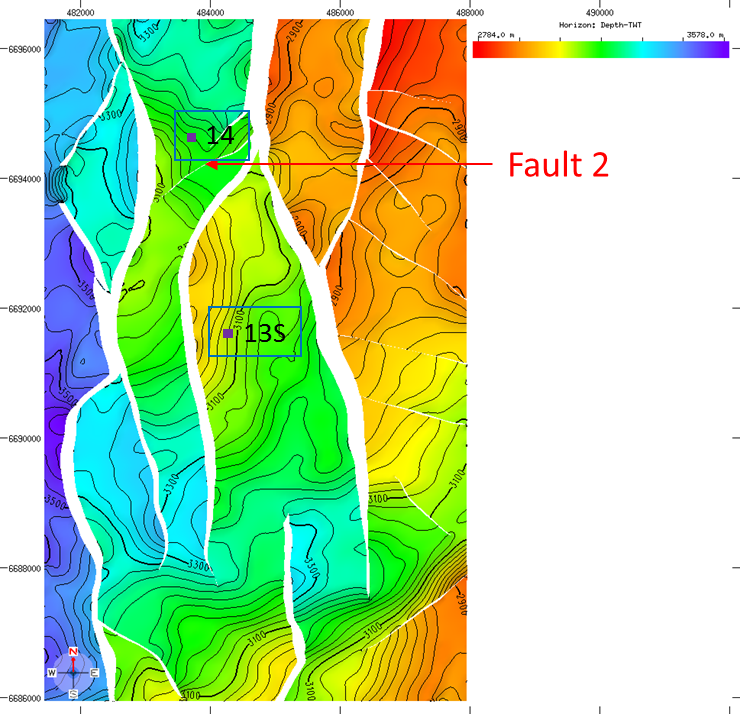
Figure 9. Fault map of the Oseberg Syd area, on the Lower Tarbert horizon, showing the location of Fault 2 (as indicated by the red arrow). |

|
Figure 10. Fault plane diagrams showing an Allan diagram (strike projection looking north) highlighting footwall horizon cut-offs (solid colour) and hanging wall horizon cut-offs (dashed). Yellow: footwall sands. Dark orange: hanging wall sands. Light orange: overlapping (juxtaposed) sands. |

|
Figure 11. Reservoir juxtaposition plot showing area of reservoir overlap filled with Shale Gouge Ratio (SGR). Low SGR values in green; high SGR values in red. |