Precision Software & Services for the Energy Industry
BGL Technical Notes
AI seismic domains: a new tool to help find hidden signal contrasts within amplitude volumes.
Keywords: AI/ML, domains, T7, reservoir, seismic
Abstract
Subtle but systematic variations in seismic character are often perceptible to experienced
interpreters yet remain difficult to objectively define, map, and communicate using conventional
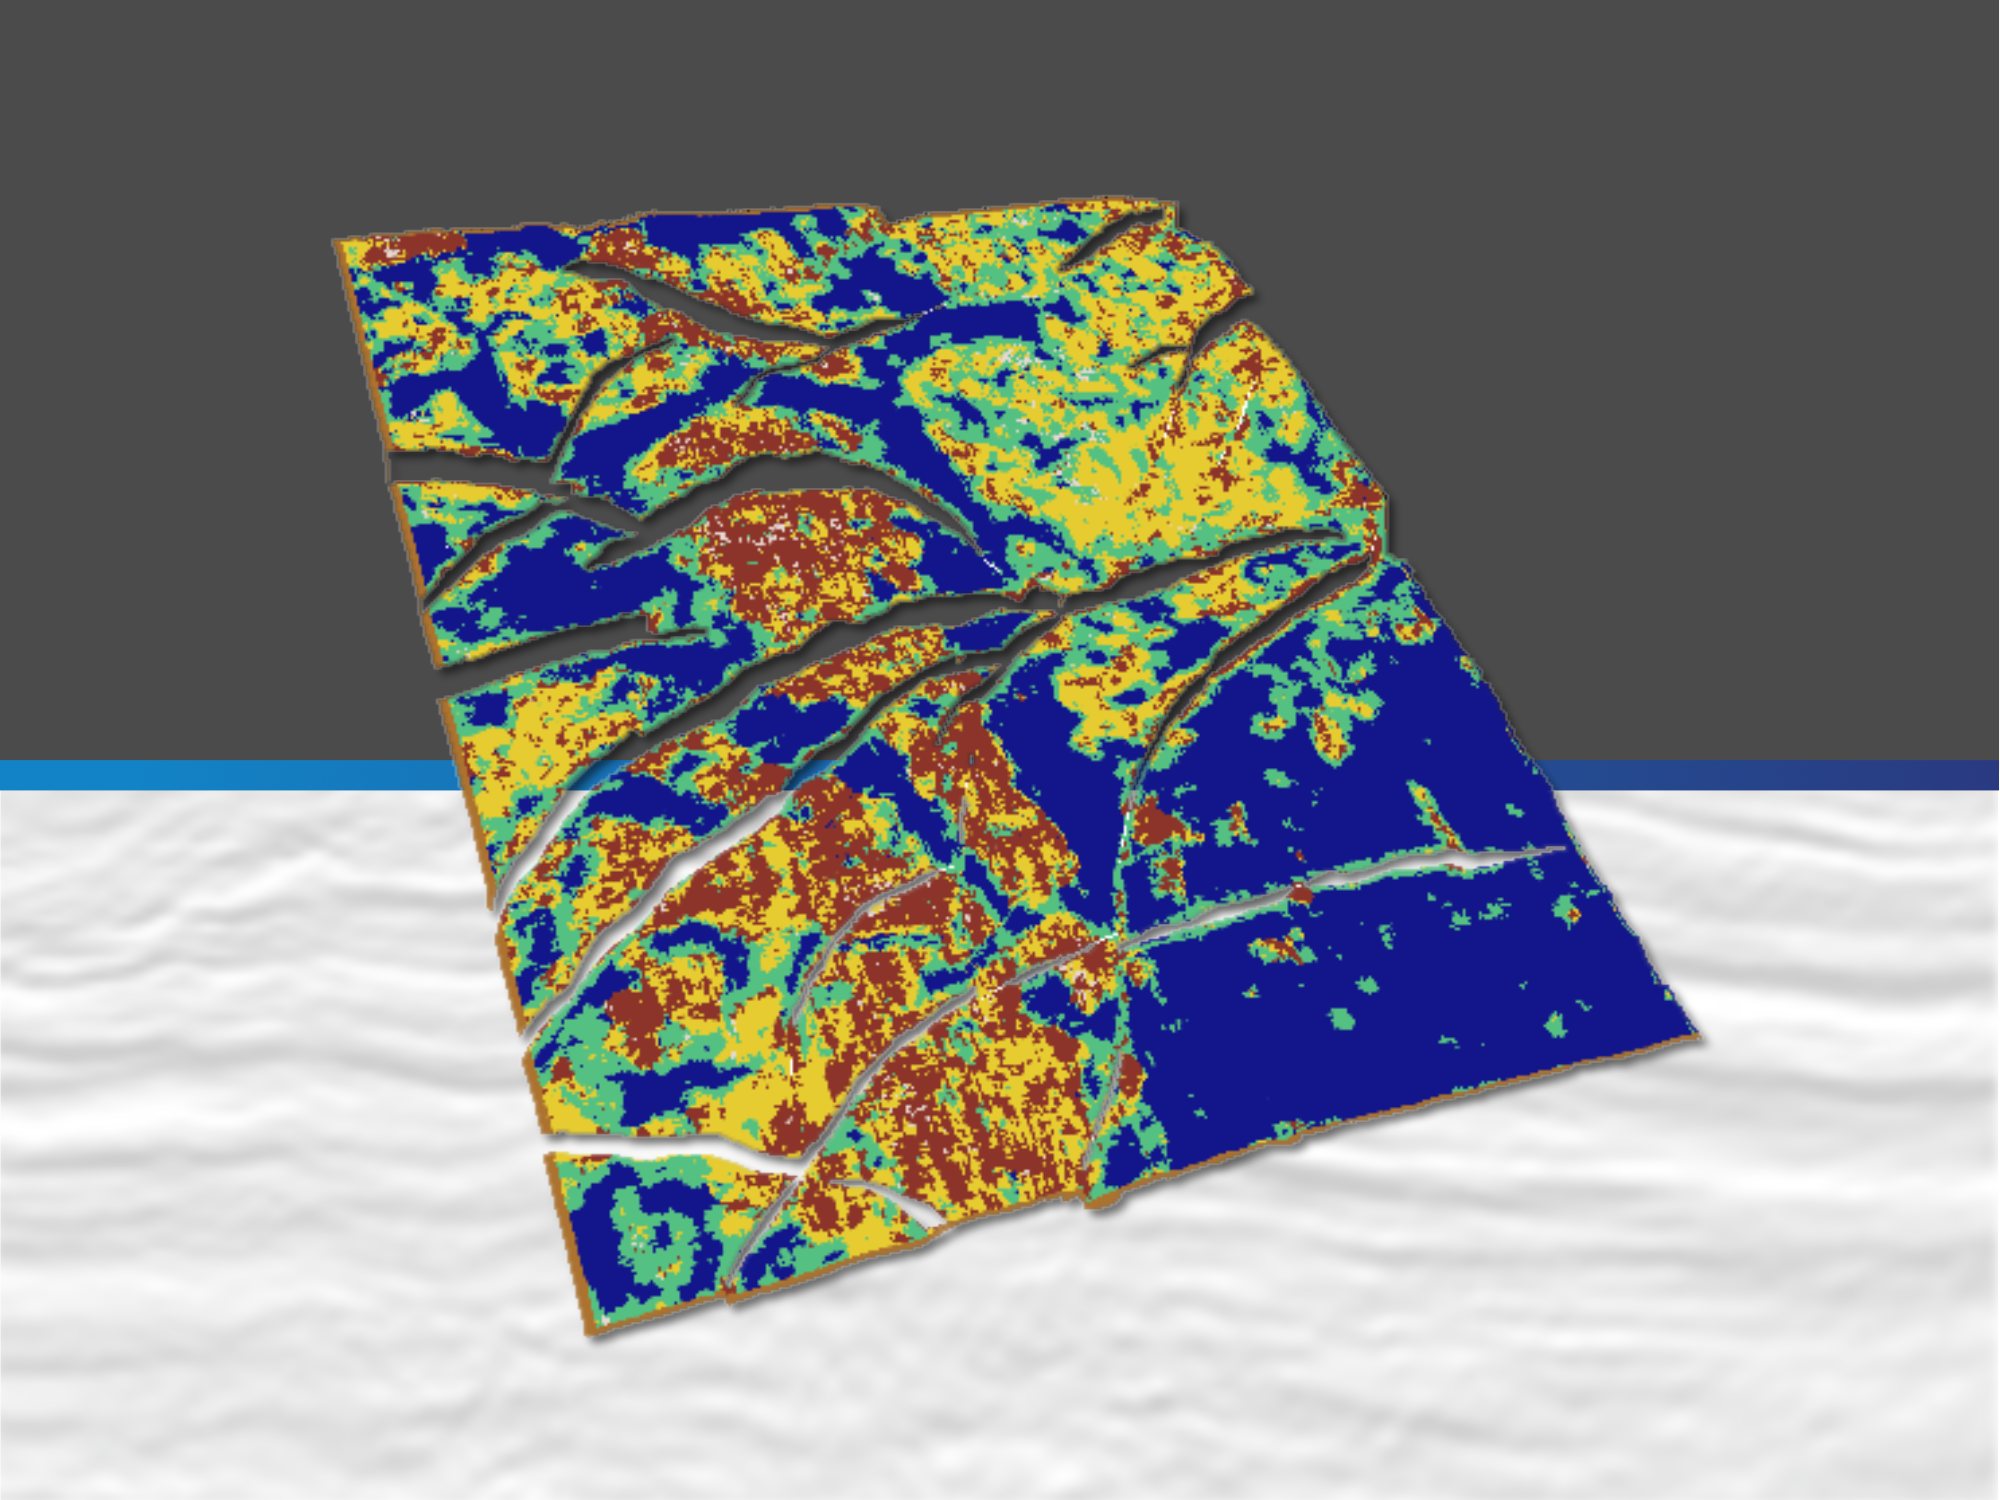
seismic attributes alone. This technical note introduces a novel AI-driven seismic domain
methodology designed to identify hidden signal contrasts within seismic amplitude volumes and
assess their geological significance. The method employs unsupervised deep learning and data
segmentation to classify seismic motifs into spatially coherent domains without requiring
labelled training data or predefined geological classes.
AI seismic domains: case study showing geological utility with reference to a fractured reservoir.
Keywords: AI/ML, domains, T7, fractures, reservoir.
Abstract
This study evaluates the utility of AI-derived seismic domains for identifying fracture-prone
regions within a Cretaceous chalk reservoir in the Gorm Field, southern North Sea, where
fracture density exerts a primary control on reservoir quality and permeability. AI domain
models were generated through unsupervised classification of seismic motifs, producing spatially
coherent categories that reflect commonality in seismic response rather than explicit geological
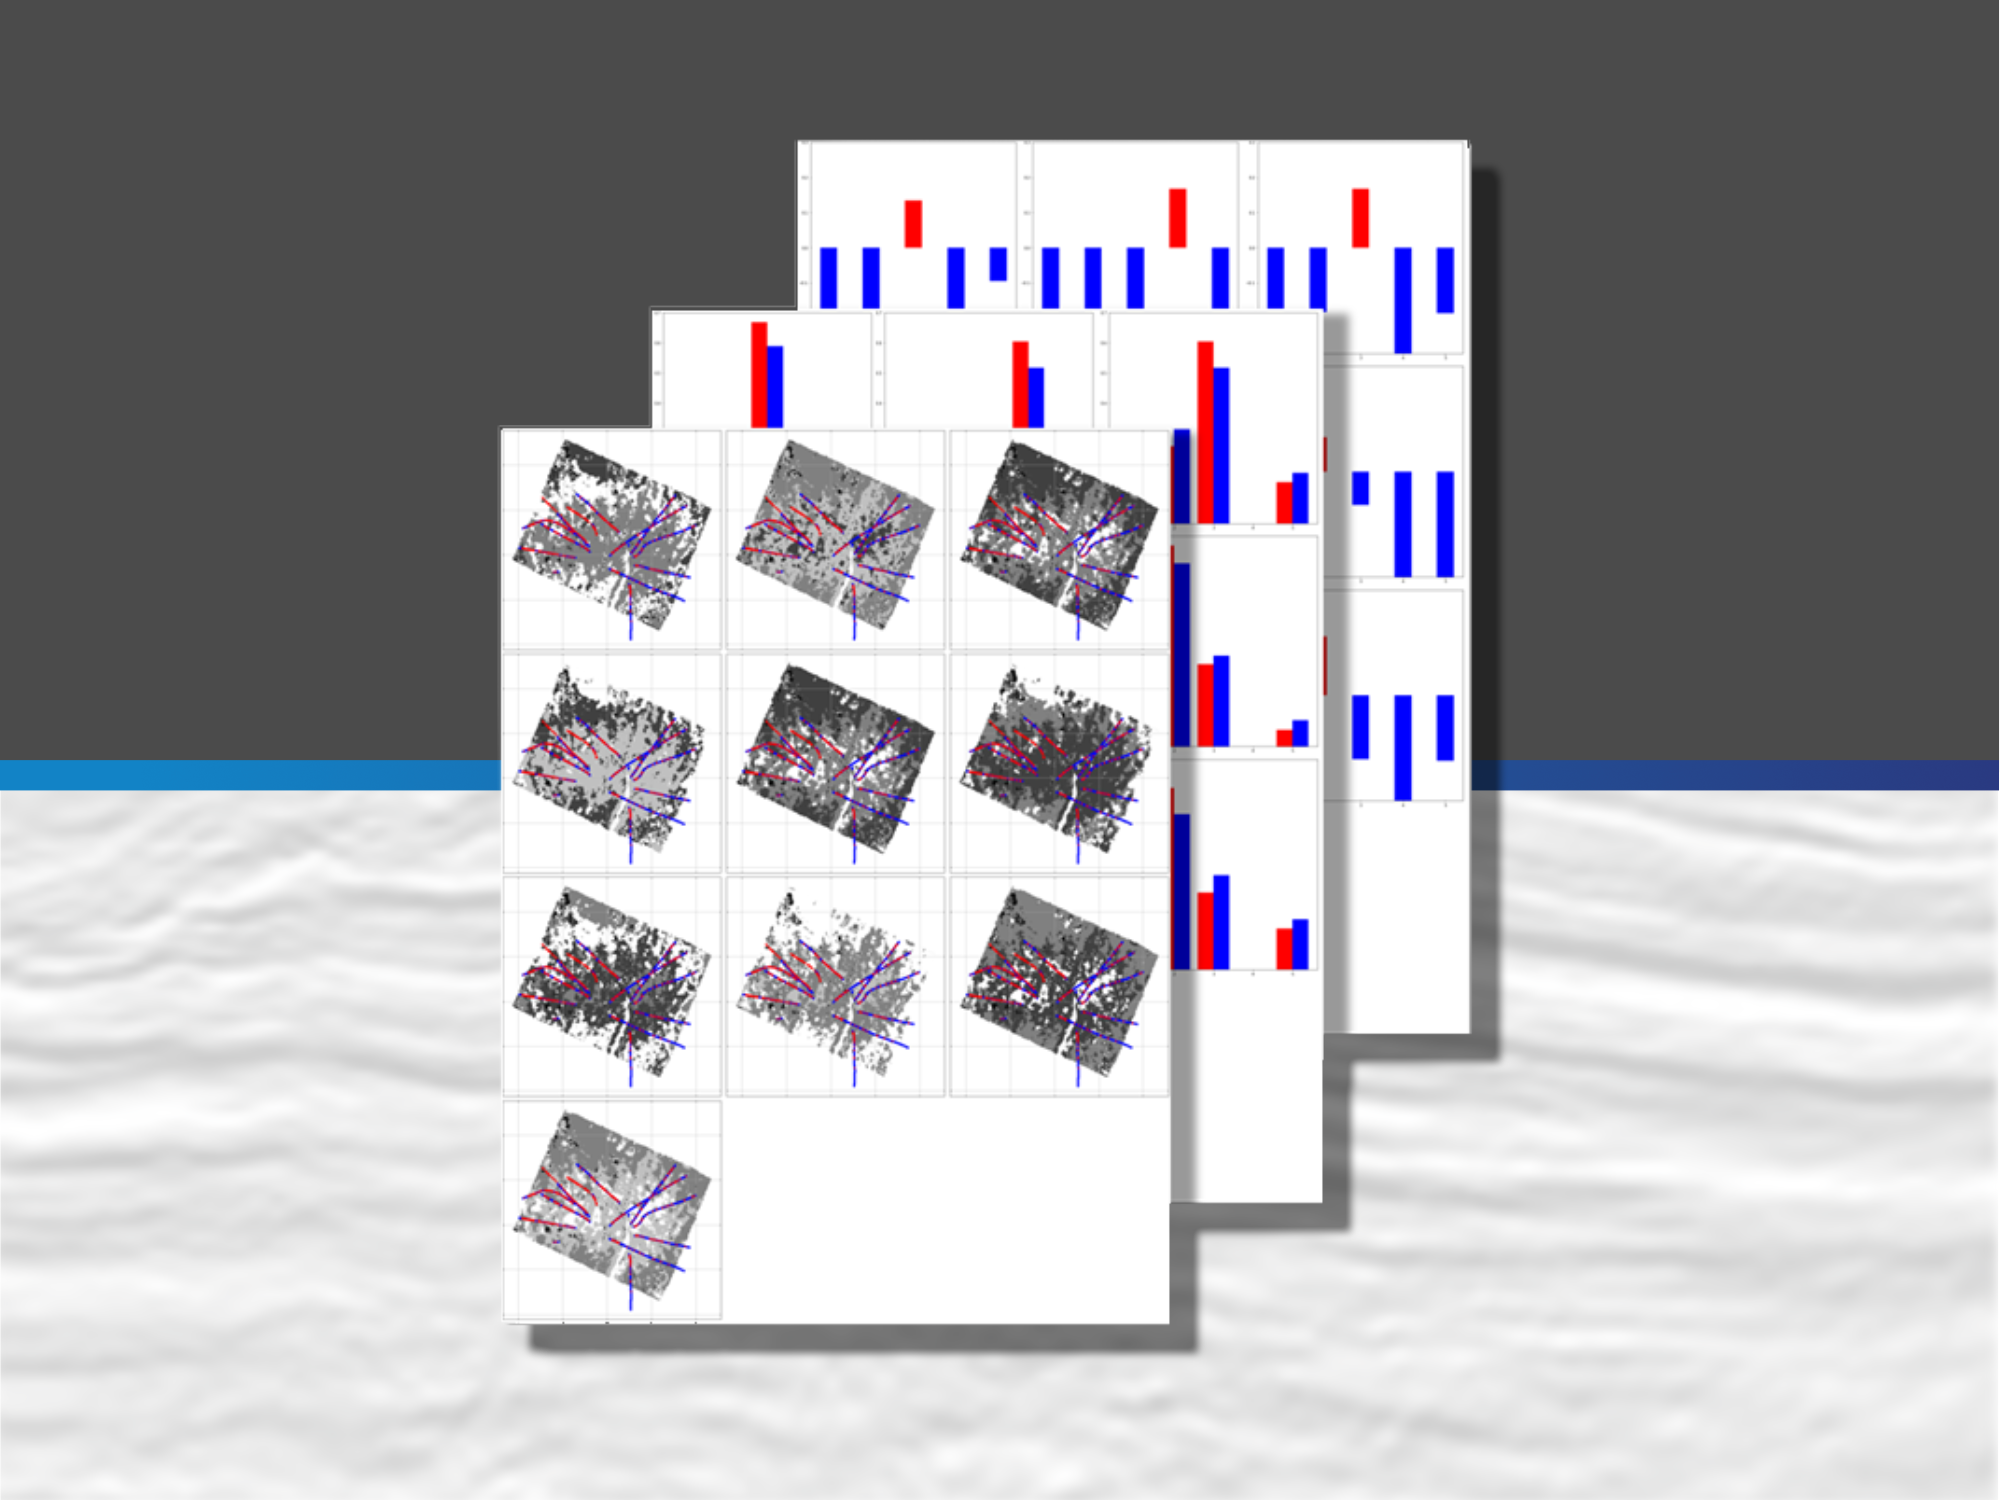
classes. Fracture-domain relationships were quantified using an enrichment ratio comparing the
probability of a domain occurring at fracture locations relative to its background occurrence
along the well trajectories. The presence of significant spatial autocorrelation, in both
fracture distributions and seismic domains, invalidates conventional independence-based
statistical testing. To address this, a suite of stochastic baseline models was generated using
segmented fractal random fields with comparable autocorrelation structures to the AI domain
models. These baseline models served as null hypotheses against which the AI-derived enrichments
were evaluated (AI domain models vs stochastic domain models). Results show that AI seismic
domain models consistently produce a single enriched domain associated with fracture occurrence,
accompanied by depletion in the remaining domains, whereas stochastic baseline models typically
generate diffuse enrichment across multiple categories. This pattern is reproducible across
simulations and resolutions. Furthermore, sensitivity analysis of the enrichment scores shows
that the stochastic domain models are markedly less stable. Taken together, all the analysis
indicated that the AI-derived seismic domains capture a genuine geological signal linked to
fracture distribution within the Top Chalk reservoir. The results suggest that, even where
fracture signatures lie below direct seismic resolution, AI domain analysis can provide
predictive information regarding relative fracture abundance and therefore reservoir quality.
This demonstrates the potential of AI seismic domains as a practical reservoir characterization
tool in structurally complex fractured systems.
Fault Seal Uncertainty Analysis
Keywords: geostatistics, T7, fault seal, sensitivity, uncertainty
Abstract
A significant proportion of the world’s conventional petroleum reservoirs occur in
structural traps. Therefore, understanding the controls on structural geometry and fault seal
are crucial steps in modelling/predicting hydrocarbon accumulation. One of the principal
mechanisms by which faults are fluid-retaining is membrane seal; this is where smeared ‘clay
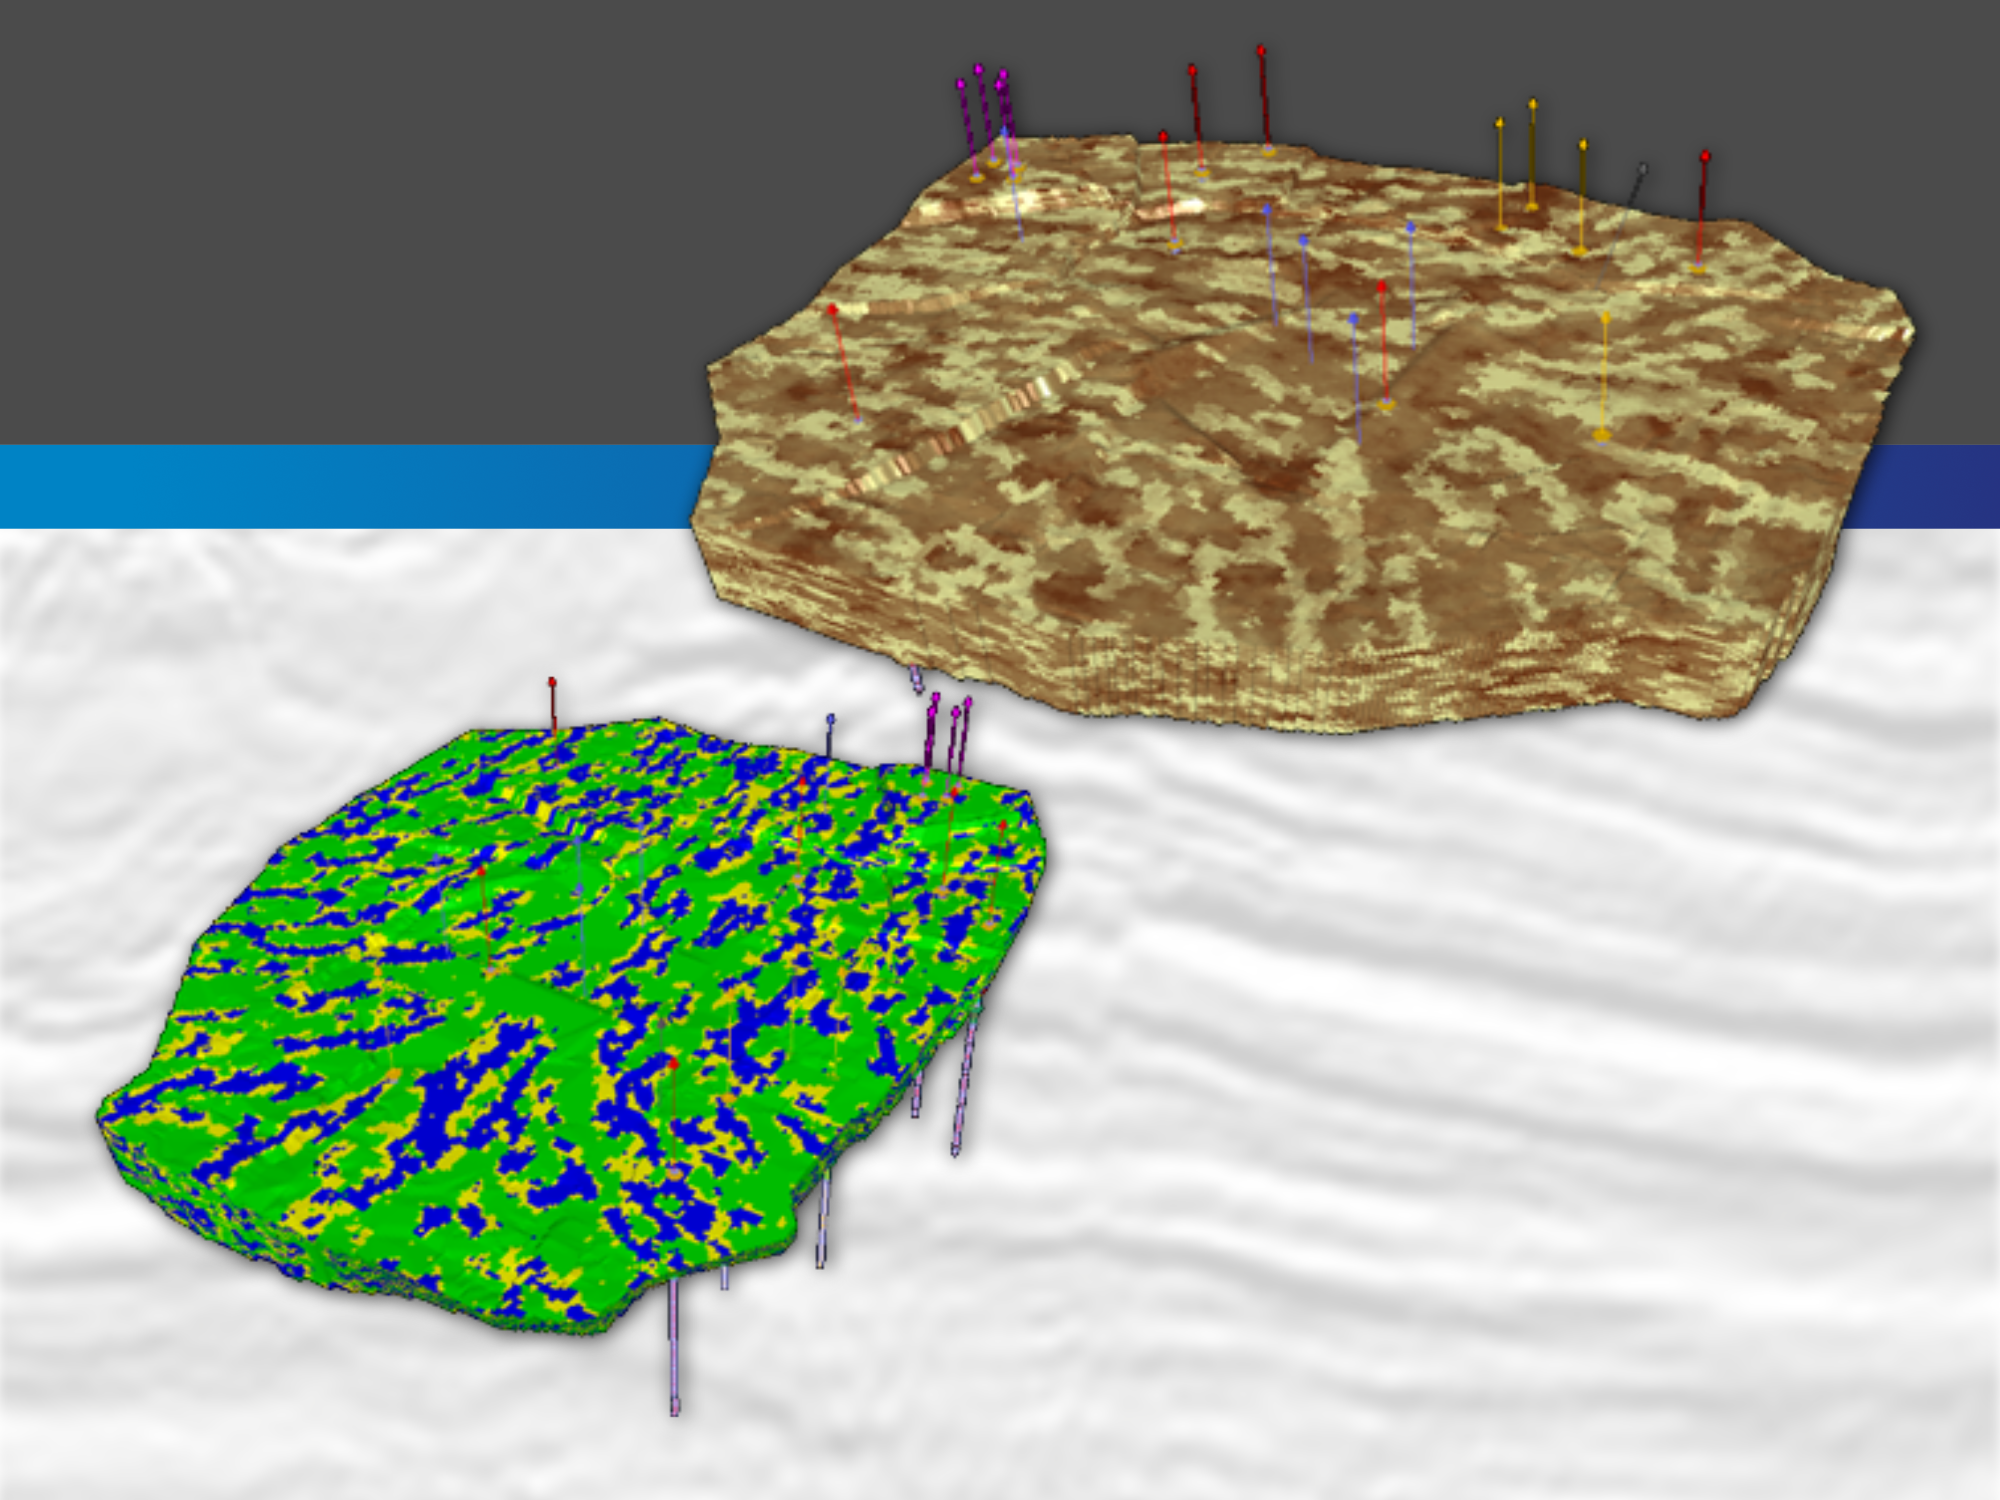
minerals’ form impermeable barriers along structural planes. The following study shows that
estimates of fault seal can be highly sensitive to the type of methods used to model the fault
rock properties. Three methods were employed: B-Spline; SGS and a combined SGS+MPS method. The
results suggest that, given the same structural model and well data, the pattern of fault seal
integrity along the fault plane can vary considerably depending on the method used. Furthermore,
stochastic methods (SGS and SGS+MPS) illustrate how uncertainty associated with the reservoir
attributes (fault rock properties) propagate through to the final fault seal model. Therefore,
uncertainties in fault seal estimates are fundamentally related to uncertainty in
the faulted rock properties. The use of stochastic methods also helped illustrate the point that
fault seal and reservoir properties are ‘coupled’ in an inverse sense so that fault seal will
improve at the expense of reservoir quality.

Analysing Fault Seal Capacities in Field Appraisal: A Case Study from Oseberg Syd
Keywords: T7, fault seal, Allan diagram, juxtaposition seals, shale gouge ratio, calibration
Abstract
A fault seal study has been performed on faults in the Oseberg Syd area, located within Block
30/9 of the Norwegian sector of the North Sea. The area is structurally complex and heavily
compartmentalised. Despite this, almost all of the individual fault blocks that have been
drilled have been found to contain oil and gas. This study attempts to achieve a better
understanding of reservoir separation, fault linkage and the likelihood for seal along
individual faults via detailed 3D structural modelling and fault seal analysis on 16
block-bounding faults using a commercial G&G software package (T7). The results (most strikingly
illustrated by two end members: a sealing fault and a non-sealing fault) suggest that SGR values
below or close to 15% correspond to no seal; SGR values between ca. 15-18% are consistent with
adjacent fault blocks having small pressure differentials (< 1 bar or 30 m difference in OWC)
and SGR values of>18% correspond to significant seal (8 bar pressure difference or up to 240 m
difference in OWC). This SGR calibration was found to be consistent with observed fluid contacts
and pressure data in all the Oseberg Syd wells. Finally, the SGR distributions for faults
lacking sufficient well control points, were used to predict likely seal capacities and
therefore constrain the occurrence of hydrocarbons in undrilled compartments.
Estimating Fault Seal and Capillary Sealing Properties in the Visund Field, North Sea
Keywords: Fault seal, shale gouge ratio, capillary seal, T7
Abstract
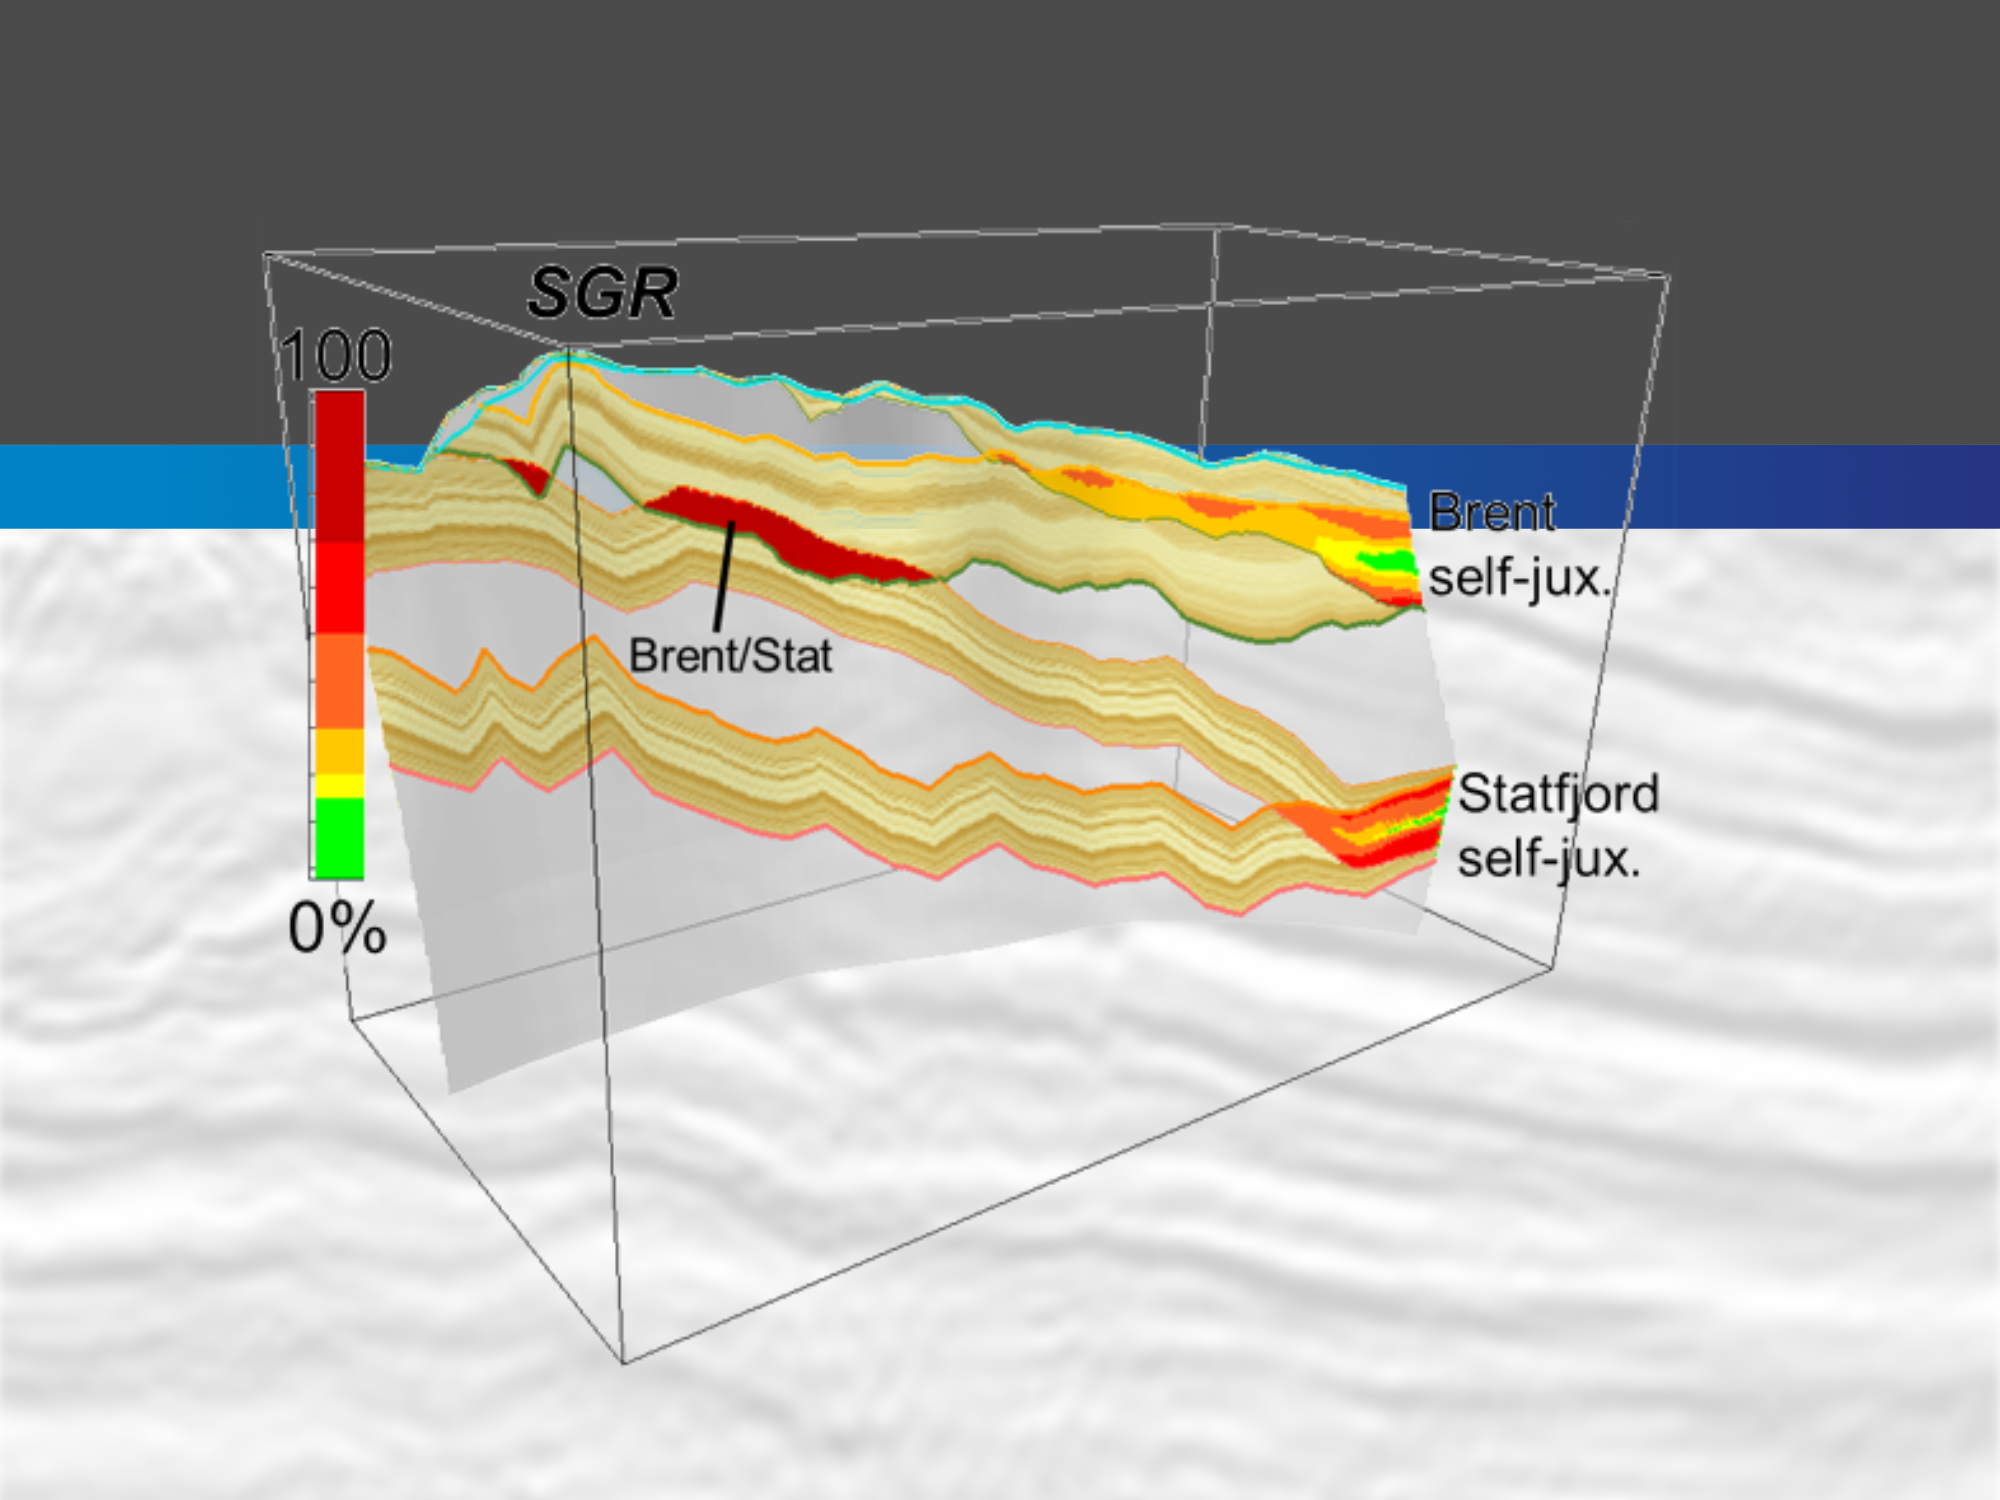
This study investigates the difference in seal/leakage mechanisms across the A-Central Fault, a
major trap bounding fault located in the westerly dipping fault block of the Visund Field, Brent
Province, North Sea. The Shale Gouge Ratio (SGR) algorithm is used to predict fault-zone
composition, using subsurface mapping and petrophysical data. These data are then used to model
threshold capillary pressure (Pc) and from this derive an estimate of maximum possible
hydrocarbon column height. Modelling suggests that the self-juxtaposed reservoirs are likely to
have poorer sealing potential and therefore across-fault leakage can occur in these regions.
However, the Brent-Statfjord juxtapositions are predicted to have higher SGR, and subsequently,
higher Pc and hydrocarbon column heights (predicted oil: 25-250 m or gas column: 15-150 m).
Observed data confirm these suppositions.